
High-Yield Investment Programs are masters of marketing, and their most potent tool is the advertised Return on Investment (ROI). A banner proclaiming '200% After 15 Days' can be incredibly enticing for investors from Manila to Mexico City. However, this headline number often obscures the true nature of the investment and its actual profitability. To make informed decisions, you must learn to look past the marketing and calculate the real ROI, taking into account crucial factors like how your principal is treated and the daily profit rate. This guide will break down the formulas and concepts you need to become a more analytical investor.
The most important factor in determining real ROI is the structure of the investment plan. There are two primary types:
Understanding this distinction is fundamental. Many experienced investors prefer 'principal included' plans for their superior risk management profile. To find programs with such plans, you can screen various HYIP rating lists.
Let's visualize the difference. Imagine two programs, both aiming for a 50% net profit over 50 days:
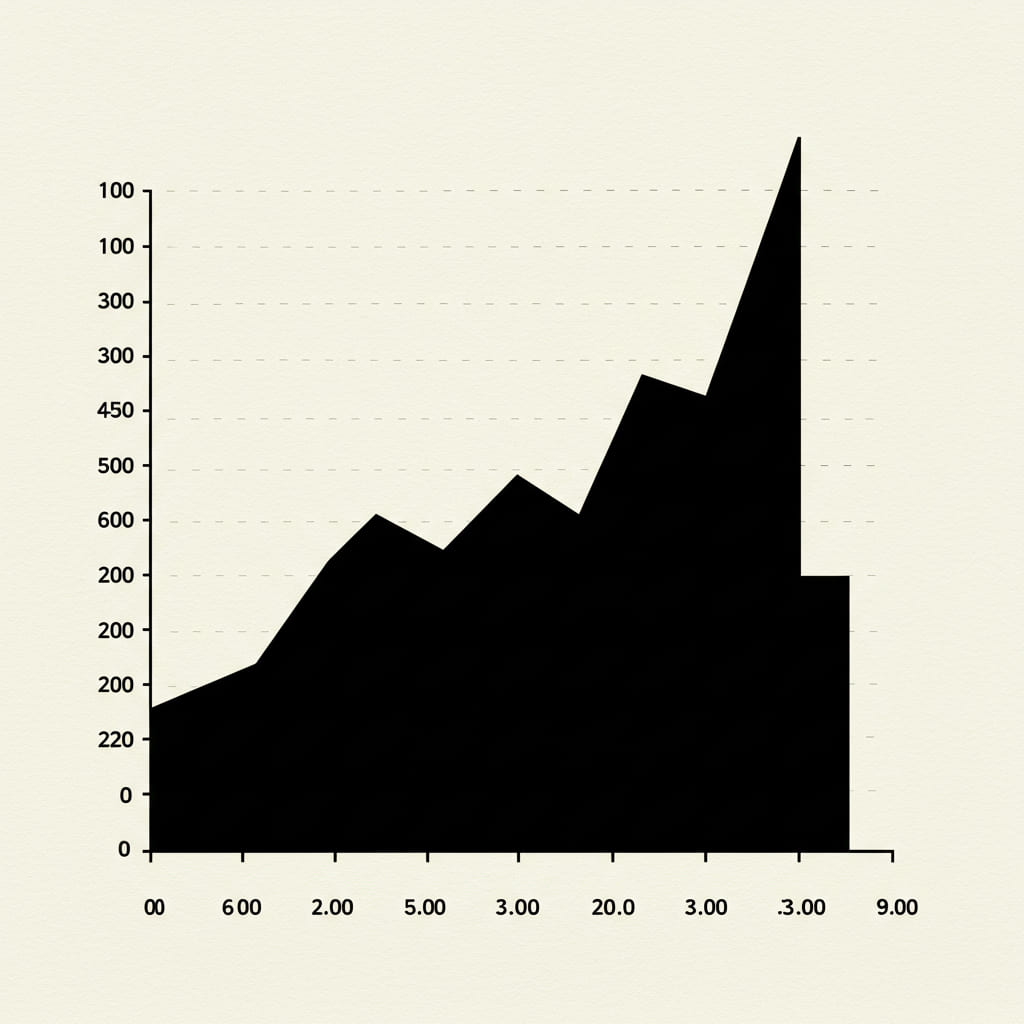
As the chart illustrates, the 'Principal Included' plan (Plan B: 3% daily for 50 days) systematically reduces your exposure, while the 'Principal Returned' plan (Plan A: 1% daily for 50 days + principal back) keeps your full capital at risk for the entire period. This risk reduction is invaluable. Your analysis must also consider the program's likely lifespan. A realistic assessment of the HYIP life cycle is crucial. For more general knowledge on calculating investment returns, the educational resources at FINRA are an excellent, reliable source.
Author: Matti Korhonen, independent financial researcher from Helsinki, specializing in high-risk investment monitoring and cryptocurrency fraud analysis since 2012.
